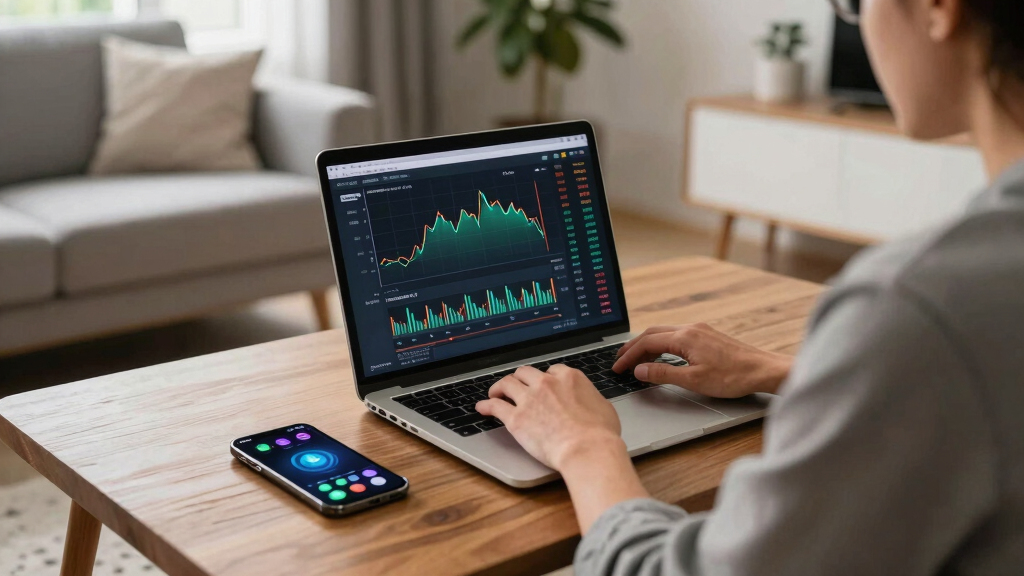

📊 Full opportunity report: Bitcoin Battles Unfold in Live Warzone Visualization on ThorstenMeyerAI.com — validation score, market gap, and execution plan.

Get hardware and tech essentials delivered free with Prime
- Fast, free delivery on millions of items
- Prime Video, Amazon Music and more included
- Member-only deals all year
TL;DR
A new web-based project visualizes Bitcoin trading as a live warzone, using real-time data streams to create an immersive, cinematic battlefield. It offers no trading advice, only a visual representation of market activity.
The Bitcoin War visualization has been officially launched, transforming real-time BTC/USDT trading data into an immersive, cinematic battlefield scene. Developed by isbitcoindead.com, this project offers viewers a live, artistic depiction of market activity, emphasizing the ongoing tug-of-war between buyers and sellers without offering trading advice. The visualization is accessible instantly via any modern browser and aims to provide a visceral, data-driven experience of market chaos, making it relevant for both tech enthusiasts and market observers.
The project connects directly to the public Binance trade stream via WebSocket, with a fallback to Coinbase, ensuring continuous data flow. Every trade tick is visualized as a combatant—buy orders from the Cobalt Host advance from the left, while sell orders from the Ember Legion counter from the right. Large liquidations are represented as airstrikes, heightening the visceral effect. The entire setup uses browser-native technologies such as Canvas 2D graphics, WebAudio synthesis, and real-time stream processing, all without backend infrastructure. An automatic camera system shifts perspectives, providing both broad battlefield views and detailed skirmishes. Additionally, a live DEFCON meter indicates market volatility, and a scrolling war log narrates ongoing activity. A synthetic soundtrack generated within the browser enhances the immersive experience. The project explicitly states that it is not a trading tool, wallet, or signal provider, but a creative visualization of market data, with the footer reading, ‘a live reading of the BTC/USDT tape · no advice, only war.’
Implications of Artistic Market Visualization for Crypto Enthusiasts
This project demonstrates how advanced web technologies can be harnessed for creative data visualization, offering a unique perspective on market dynamics. It provides a visceral, artistic view of Bitcoin trading activity, which could influence how traders, analysts, and enthusiasts perceive market chaos and volatility. While it does not provide trading signals or advice, its immersive nature offers a new way to interpret real-time data, potentially fostering greater understanding of market turbulence and liquidity shifts.
Bitcoin trading visualization software
As an affiliate, we earn on qualifying purchases.
As an affiliate, we earn on qualifying purchases.
Development of Web-Based Market Visualizations
The concept of visualizing market activity as an artistic or cinematic experience has been explored in various forms, but this project by isbitcoindead.com is notable for its real-time, browser-native implementation. It builds on recent advances in web graphics and stream processing, emphasizing minimal infrastructure and accessibility. The launch comes amid increasing interest in innovative ways to interpret and present financial data, especially in the volatile crypto markets. Prior efforts have included static visualizations and data dashboards, but none have offered this level of cinematic immersion directly in a browser.
“This visualization offers a compelling, visceral perspective on Bitcoin trading activity, emphasizing the chaos and intensity of market fluctuations.”
— an anonymous researcher
As an affiliate, we earn on qualifying purchases.
Unconfirmed Aspects of the Visualization’s Impact and Scope
It is not yet clear how widely this visualization will be adopted or whether it will influence trading behavior. The project’s creators emphasize its artistic intent, but its potential to impact market perception or trader psychology remains untested. Additionally, questions remain about the scalability of the visualization, its accuracy in representing market activity, and whether similar tools could be developed for other assets or markets. The long-term reception and possible integration into trading platforms are still unknown.
As an affiliate, we earn on qualifying purchases.
Future Developments and Potential Enhancements
Developers plan to continue refining the visualization, possibly adding features such as customizable views, more detailed analytics, or integration with other data streams. They may also explore user engagement, including interactive elements or educational components. As the project gains attention, it could inspire similar artistic visualizations for other cryptocurrencies or financial markets. Monitoring user feedback and technological advancements will shape future updates, while broader adoption could see this approach influence creative data presentation in finance.
web-based Bitcoin market visualization
As an affiliate, we earn on qualifying purchases.
As an affiliate, we earn on qualifying purchases.
Key Questions
Is this visualization a trading tool or signal provider?
No, the project explicitly states it is not a trading tool or signal provider. Its purpose is solely artistic and educational, offering a visual representation of market activity without advice or recommendations.
How does the visualization connect to real-time data?
It connects directly to the public Binance trade stream via WebSocket, with a fallback to Coinbase, ensuring continuous, real-time updates of BTC/USDT trades displayed as a battlefield scene.
Can I customize or interact with the visualization?
Currently, the visualization offers automatic camera perspectives and a fixed display. Future updates may include more interactive features, but at present, it functions as a passive, cinematic experience.
Is this visualization accessible on all devices?
Yes, it runs instantly in any modern browser, making it widely accessible without requiring downloads or installations.
Will this visualization influence trading decisions?
No, it is designed purely for artistic and educational purposes. It does not provide trading signals or advice.
Source: ThorstenMeyerAI.com
Halloween Picks
halloween
As an affiliate, we earn on qualifying purchases.