
To avoid being fooled by token dashboards, you should analyze token allocation to see who holds what and watch for concentration risks. Pay attention to market trends, volume, and sentiment to distinguish genuine growth from hype. Track transfer activity for signs of stability or trouble, and understand vesting schedules to anticipate market shocks. Be cautious of manipulation tactics and combine insights for a clearer picture. Keep exploring—more tips are just ahead to sharpen your analysis.

Get hardware and tech essentials delivered free — and shop member deals
- Fast, free delivery on millions of items
- Access to Prime Big Deal Days deals on October 6–7
- Prime Video, Amazon Music and more included
Key Takeaways
- Analyze token allocation to identify potential risks from concentrated holdings and market manipulation.
- Cross-reference market trends with news and sentiment to distinguish genuine growth from hype.
- Monitor transfer activity for patterns indicating healthy growth or possible liquidation issues.
- Understand vesting schedules to anticipate future token releases and avoid surprises.
- Combine insights from distribution and activity data to prevent misinterpretation and misleading signals.
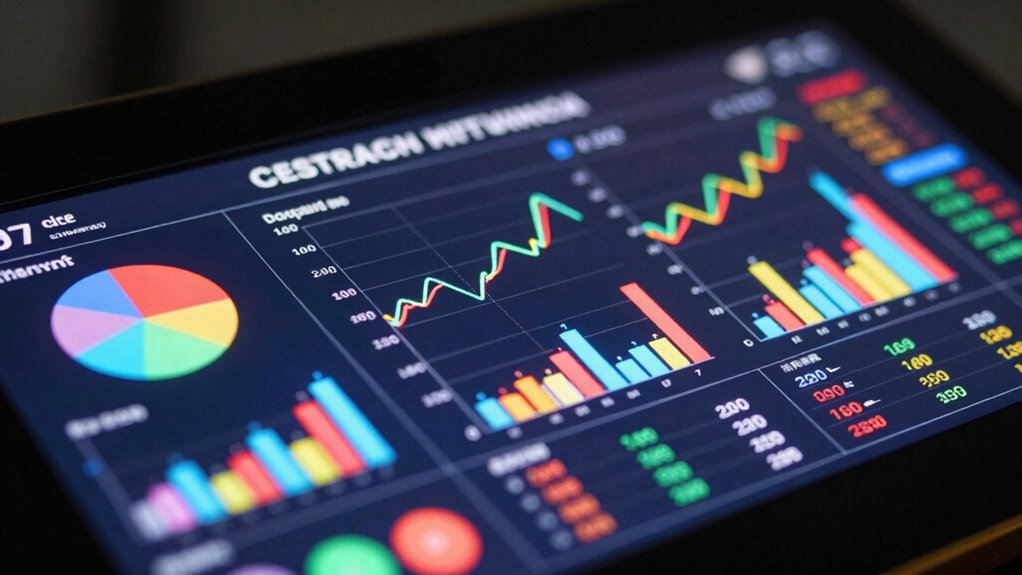
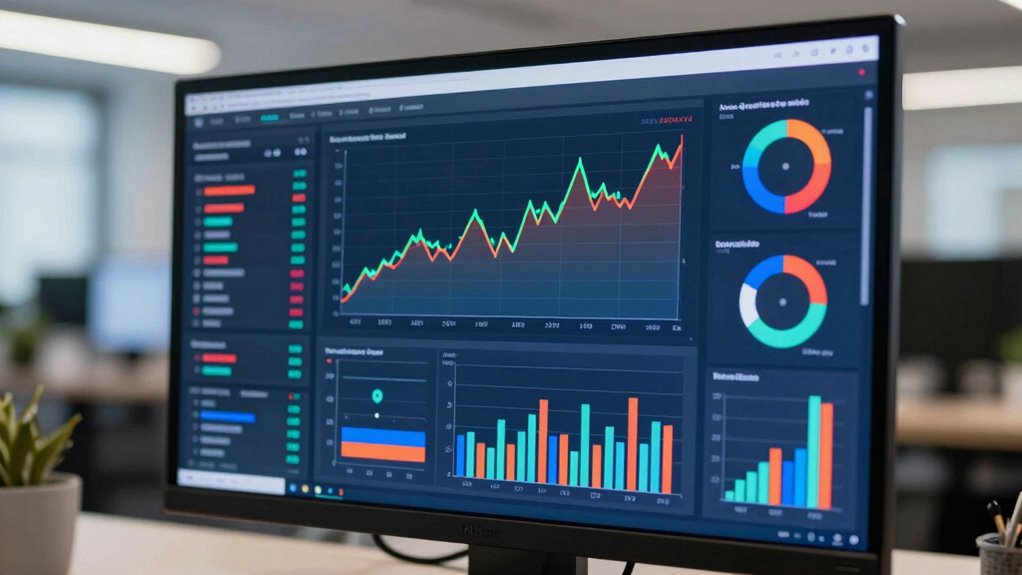
Token dashboards are essential tools for tracking the performance and health of your digital assets, but understanding how to interpret them can seem intimidating at first. When you open a dashboard, it’s tempting to focus solely on the numbers that catch your eye — like price changes or volume spikes. However, to truly grasp what’s happening, you need to look beyond the surface. One of the most important aspects is examining token allocation. This shows you how tokens are distributed among different stakeholders, such as founders, investors, or the community. If a large percentage is concentrated in a few hands, it could signal potential risks, like market manipulation or sudden sell-offs. Recognizing these patterns helps you assess whether the token’s current performance is sustainable or if it’s driven by short-term speculation.
Market trends are equally crucial in understanding your dashboard. Instead of reacting emotionally to rapid price swings, analyze the broader market context. Are these movements part of a larger trend, or are they isolated incidents? Pay attention to indicators like trading volume and price momentum, but also cross-reference with market sentiment and news. If the entire crypto space is bullish and your token’s price is climbing, it might be a sign of genuine growth. Conversely, if your token’s rise coincides with a pump driven by hype or coordinated buying, it’s a red flag. Recognizing how market trends influence your token’s chart helps prevent you from fooling yourself into thinking every uptick is a sign of long-term value.
Additionally, understanding the distribution of tokens and their potential impact on market stability can provide deeper insights. As you interpret your dashboard, stay aware of the data’s context. Look for patterns over time rather than fixating on single data points. For example, a spike in token transfer activity could mean different things depending on whether it’s linked to a major partnership announcement or a large holder liquidating their position. Always ask yourself what’s driving the numbers and whether those factors indicate healthy growth or potential trouble. Moreover, paying attention to token vesting schedules can give you a clearer picture of future market behavior, as vested tokens are often released gradually to prevent sudden dumps. This knowledge helps you anticipate market shocks and better prepare for potential fluctuations. Understanding the distribution mechanisms behind token releases can help you anticipate potential market impacts and avoid surprises. It’s also beneficial to consider how market manipulation tactics might influence these metrics, so you can better identify artificial movements. By combining insights from token allocation and market trends, you develop a more accurate picture of your asset’s true health. This approach prevents you from being misled by hype or short-term fluctuations, enabling more informed decisions. In the end, reading token dashboards isn’t just about the numbers — it’s about understanding the story behind them and avoiding the trap of fooling yourself into thinking that every quick spike is a sign of lasting success.
cryptocurrency token allocation analysis tool
As an affiliate, we earn on qualifying purchases.
As an affiliate, we earn on qualifying purchases.
Frequently Asked Questions
How Often Should I Review Token Dashboard Data?
You should review your token dashboard data daily to stay on top of token valuation changes and market trends. Regular checks help you catch fluctuations early and adjust your strategies accordingly. If you’re actively trading or investing, consider more frequent reviews—perhaps multiple times a day. For long-term holders, weekly or bi-weekly reviews might suffice. Consistent monitoring guarantees you’re informed and ready to act when market trends shift.
What Are Common Mistakes When Interpreting Token Metrics?
Are you overlooking key pitfalls that skew your understanding? Common mistakes include relying solely on token valuation without considering market sentiment, which can lead to false optimism or pessimism. Another mistake is ignoring the context behind metrics, such as recent market events. You might also misinterpret activity spikes as genuine growth instead of temporary hype. Always combine token metrics with market sentiment and context for a clearer, more accurate picture.
How Can I Verify the Accuracy of Dashboard Data?
To verify the accuracy of dashboard data, prioritize token transparency by understanding where the data comes from and how it’s collected. Use data validation techniques, like cross-referencing with blockchain explorers or third-party analytics tools, to confirm metrics. Regularly audit your sources, question anomalies, and guarantee the dashboard updates in real time. This way, you maintain trust in your insights and avoid making decisions based on incorrect information.
Which Metrics Are Most Critical for Assessing Token Health?
Think of evaluating token health like checking your essential signs; the most critical metrics are token liquidity and market capitalization. Liquidity shows how easily you can buy or sell without affecting price, while market cap indicates the token’s overall value and stability. Monitoring these helps you gauge the token’s robustness, ensuring you’re not fooled by surface-level data. Focus on these metrics to make smarter decisions and understand true token health.
How Do I Compare Token Dashboards Across Different Platforms?
To compare token dashboards across platforms, start by analyzing token liquidity, which shows how easily you can buy or sell tokens without impacting the price. Next, evaluate community engagement metrics like active users and social activity to gauge ongoing interest. Look for consistency in these metrics across platforms, and be wary of sudden spikes or drops, which could indicate manipulation or short-term hype rather than genuine health.
crypto market sentiment indicator
As an affiliate, we earn on qualifying purchases.
As an affiliate, we earn on qualifying purchases.
Conclusion
Now that you know how to decode token dashboards, you’re equipped to spot the real signals from the noise. But remember, these dashboards can still hide surprises—trust your instincts and stay vigilant. Will the next chart reveal a hidden opportunity or a looming risk? Keep questioning what you see, because in the world of tokens, what’s hidden often matters most. Stay sharp—your next move depends on it.
blockchain transfer activity tracker
As an affiliate, we earn on qualifying purchases.
As an affiliate, we earn on qualifying purchases.
As an affiliate, we earn on qualifying purchases.
Fall Picks
fall essentials
As an affiliate, we earn on qualifying purchases.