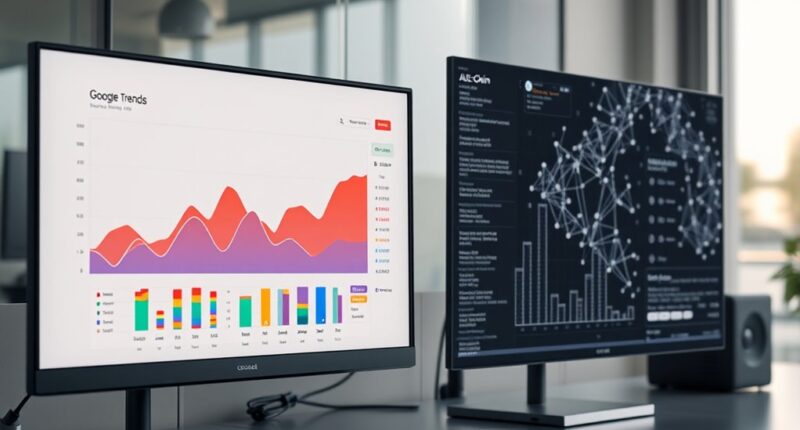
To gauge alt season prospects, you should look at both Google Trends and on-chain data. Rising search interest indicates growing public curiosity and hype, but it may not mean actual investment. On-chain data, like wallet activity and transaction volume, shows genuine investor confidence and accumulation. Combining these signals helps you better understand market momentum. If you want to learn how to interpret these metrics effectively, there’s more to explore ahead.
Key Takeaways
- Google Trends measures public interest and hype, often preceding market rallies, while on-chain data reflects actual investor commitment.
- Rising search volumes indicate increased curiosity, but on-chain activity confirms genuine accumulation by investors.
- Combining Google Trends with on-chain metrics provides a comprehensive view of potential altcoin season signals.
- On-chain data showing wallet growth and transaction volume suggest stronger investor confidence than search trends alone.
- Relying on both tools enhances timing accuracy for entering altcoins during upcoming market rallies.

Have you ever wondered how investors determine when altcoins are ready to surge? It’s a question that’s central to steering the often unpredictable world of cryptocurrency. To make informed decisions, many look beyond price charts and dig into the underlying signals that reveal market sentiment and investor behavior. Two popular tools for gauging these signals are Google Trends and on-chain data. Each offers a distinct perspective, but comparing their insights can give you a clearer picture of when the next altcoin rally might occur.
Google Trends tracks the popularity of search queries related to specific cryptocurrencies. When interest in altcoins spikes on this platform, it usually indicates that a broader audience is becoming curious or optimistic about those tokens. This surge in search activity often reflects shifting market sentiment — a feeling that the market is warming up for a potential rally. However, it’s essential to remember that Google Trends captures public interest, which can be driven by hype, news, or social media buzz. So, while rising search volume can signal increased investor curiosity, it doesn’t necessarily confirm that buying activity is happening at scale. Instead, it highlights a shift in investor behavior — more people are paying attention, possibly preparing to act.
On-chain data, on the other hand, provides a more granular look at what actual investors are doing. It includes metrics like wallet activity, transaction volumes, and holding patterns. For example, an increase in active addresses or a rise in large wallet transactions can suggest that serious investors are accumulating altcoins, signaling genuine confidence in their prospects. Conversely, a spike in transaction volume without a corresponding increase in holding might indicate speculative trading rather than long-term interest. This on-chain activity tends to be a more reliable indicator of investor behavior because it’s based on real actions rather than just online searches or social media chatter. When on-chain data shows sustained accumulation, it’s often a stronger sign that a market uptrend could be imminent. Additionally, high high refresh rates can improve the overall gaming experience, making data analysis even more responsive for traders monitoring market shifts.
Frequently Asked Questions
How Do Macroeconomic Factors Influence Alt Season Predictions?
Macroeconomic factors play a big role in shaping your alt season predictions. When macroeconomic indicators show economic stability, the investment climate becomes more favorable, encouraging you to invest in altcoins. Conversely, economic downturns or high inflation can cause you to hesitate, affecting altcoin performance. Keeping an eye on these macroeconomic shifts helps you better anticipate alt season trends and make smarter investment decisions during changing economic times.
Can Social Media Sentiment Predict Altcoin Surges?
You can sometimes predict altcoin surges through social media sentiment analysis, especially when you pay attention to influencer impact. If influencers boost positive sentiment, it often sparks buying interest among followers, leading to price jumps. However, stay cautious, as social media hype can be fleeting. Combining sentiment analysis with other data gives you a clearer picture, helping you make better-informed decisions about potential surges.
What Role Does Developer Activity Play in Alt Season Metrics?
You should consider that developer activity plays a vital role in alt season metrics. Increased developer engagement often signals ongoing network upgrades and improvements, which can boost confidence and interest among investors. When developers actively work on the project, it indicates a healthy, evolving ecosystem. This, in turn, can lead to price surges and altcoin rallies, making developer activity a key indicator for potential alt season opportunities.
Are There Specific Altcoins That Typically Outperform During Alt Seasons?
You might notice certain altcoins tend to outperform others during alt seasons, following recognizable seasonal patterns. Altcoin winners often include established projects with active communities and strong fundamentals. Keep an eye on trending tokens and those with recent developments or partnerships, as these tend to capitalize on seasonal surges. By tracking these seasonal patterns, you can better position yourself to identify potential outperformers during alt seasons.
How Does Market Liquidity Impact the Reliability of Trend Data?
Market liquidity directly impacts the reliability of trend data, especially during periods of market volatility. When liquidity is high, your data becomes more accurate because transactions are smoother and reflect true demand. However, low liquidity can distort trend signals, making data less reliable. You should be cautious, as reduced liquidity can lead to false signals, affecting your ability to make informed decisions based on the trend data.
Conclusion
By comparing Google Trends and on-chain data, you gain a clearer picture of alt season dynamics. Trends show when interest peaks, while on-chain metrics reveal actual investor activity. Using both together helps you make better-informed decisions, spotting potential rallies early. Keep monitoring these metrics consistently, and you’ll stay ahead of the market shifts. Remember, combining different data sources gives you the best edge in steering through alt season opportunities.


